Spot VMs are cheap — until they vanish
Spot / preemptible pricing vs. on-demand
AWS 120 s · GCP 30 s preemptible
Can the machine durably evacuate all relevant state to object storage before shutdown?
Averages hide deadline failures
✗ Throughput benchmark
"Average upload speed: 500 MB/s"
Does not tell you whether every part completed, whether one part became a straggler, or whether finalization succeeded before shutdown.
✓ Deadline-bounded completion
"Did the entire end-to-end upload finish before time W?"
Binary outcome. An upload that completes one second after the deadline is a failure, even if the object eventually becomes available.
The Safe Operating Area frontier
What it gives operators
A concrete configuration-to-safety boundary. If Smax = 12 GiB, then 12 GiB is the largest tested size that passes the certification rule. It does not mean 13 GiB is necessarily unsafe — it may not have been tested.
Research questions
RQ 1 — What frontier do we observe for each provider and deadline?
RQ 2 — Which tuning knob moves the frontier more: chunk size or parallelism?
How operators use the frontier
The SOA produces a measure → cache → admit workflow that can be reused across deployments.
region, and instance family
as an admission-control table
vs. cached frontier
Experimental setup & certification rule
Setup
- Real AWS and GCP VMs, writing to same-region provider object storage
- State sizes: 4, 8, 12, 16 GiB
- Chunk sizes: 8, 16, 64 MiB
- Parallelism: 10, 16, 64 threads
- Deadlines: 30, 60, 120 seconds
25.7 M part upload attempts · 37.6 K runs · 6 regions · 5 instance families
Success = entire end-to-end completion (incl. multipart finalization) before deadline W.
Certification
Each run is a Bernoulli trial — a coin flip: did the upload finish in time, yes or no?
From those flips, compute a Wilson lower confidence bound — a pessimistic estimate of the true success rate, accounting for limited sample size.
Certified safe only when that pessimistic estimate ≥ 95%
What "certified-safe" means
Deliberately conservative
We do not use the raw observed success rate. If 19 out of 20 runs succeed, the observed rate is 95% — but with only 20 samples, the true rate could be lower. The Wilson lower bound accounts for that sample uncertainty, giving us a pessimistic estimate that must still exceed 95%.
A small number of deadline misses — or insufficient evidence — can prevent certification.
Outside the SOA ≠ proven impossible
A point outside the Safe Operating Area is not necessarily proven to fail. It means we do not have sufficiently strong evidence to recommend it as safe.
The rule is deliberately harsh: limited evidence or a small number of misses can prevent a cell from being called safe.
The certified frontier: GCP dominates AWS
Why the frontier diverges: tail structure
CCDF = "what fraction of uploads took longer than x seconds?" — higher means more slow uploads.
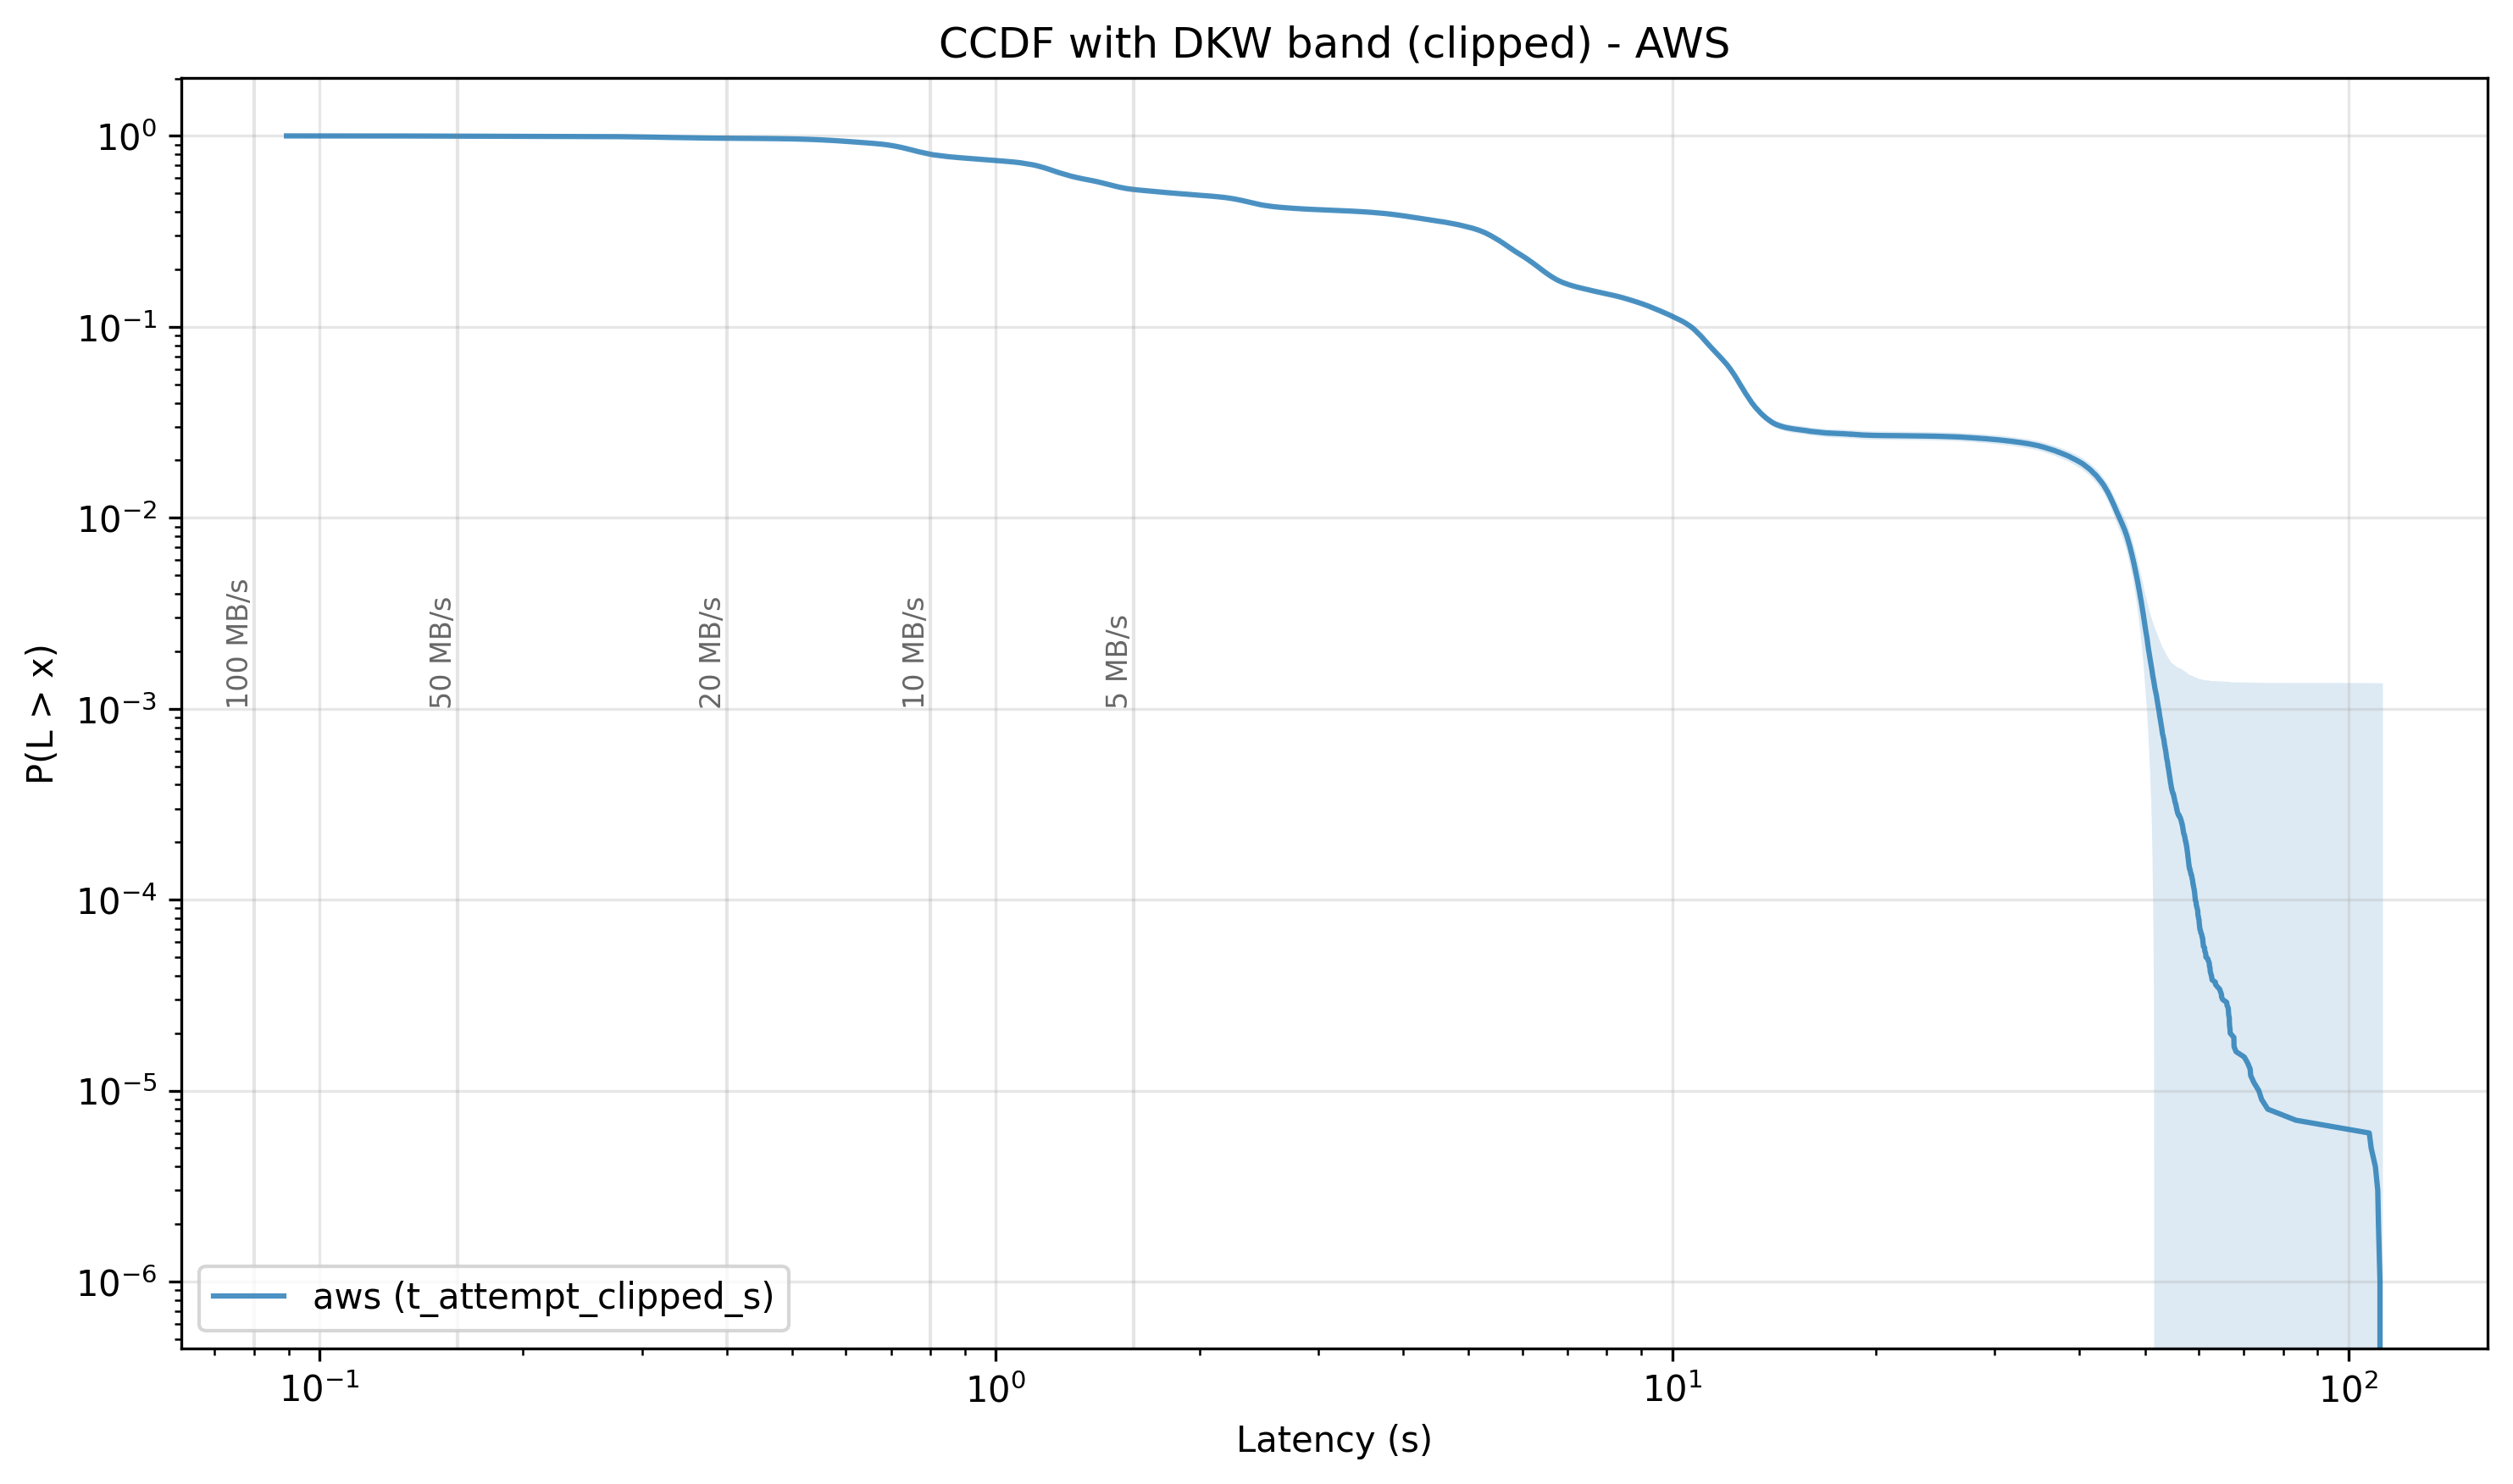
AWS tail extends to ~100 s
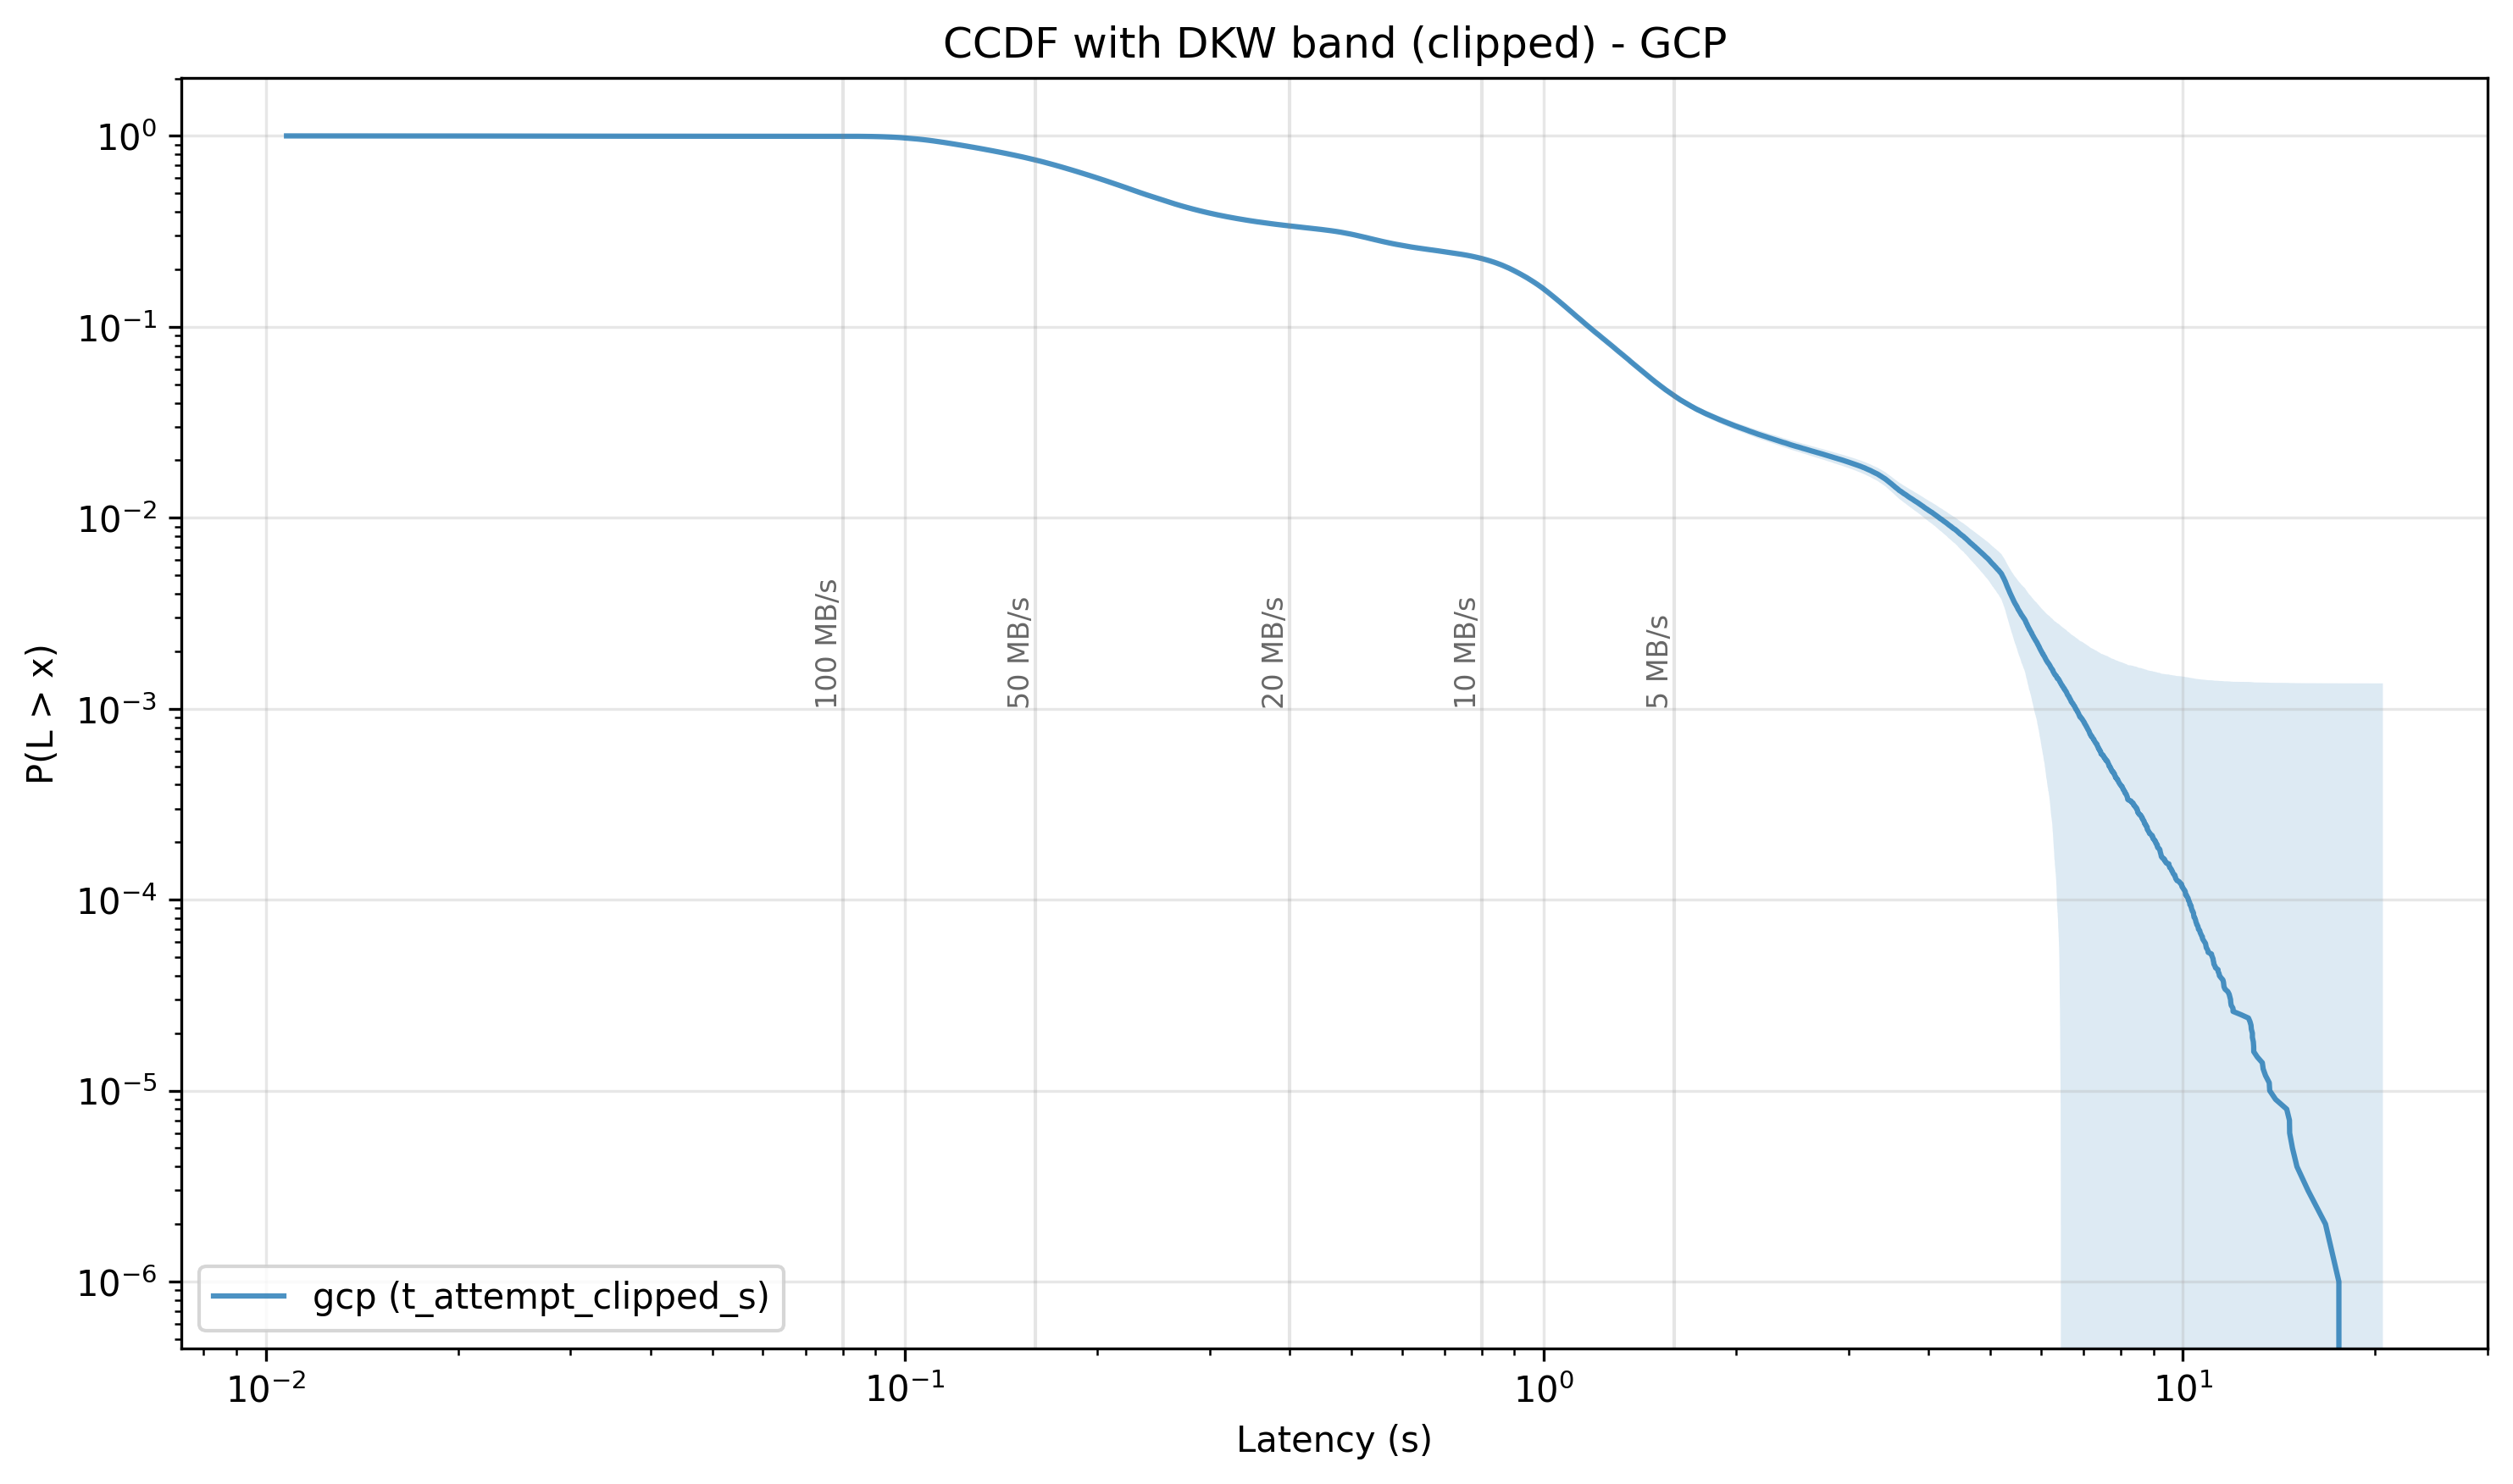
GCP tail cuts sharply at ~20 s
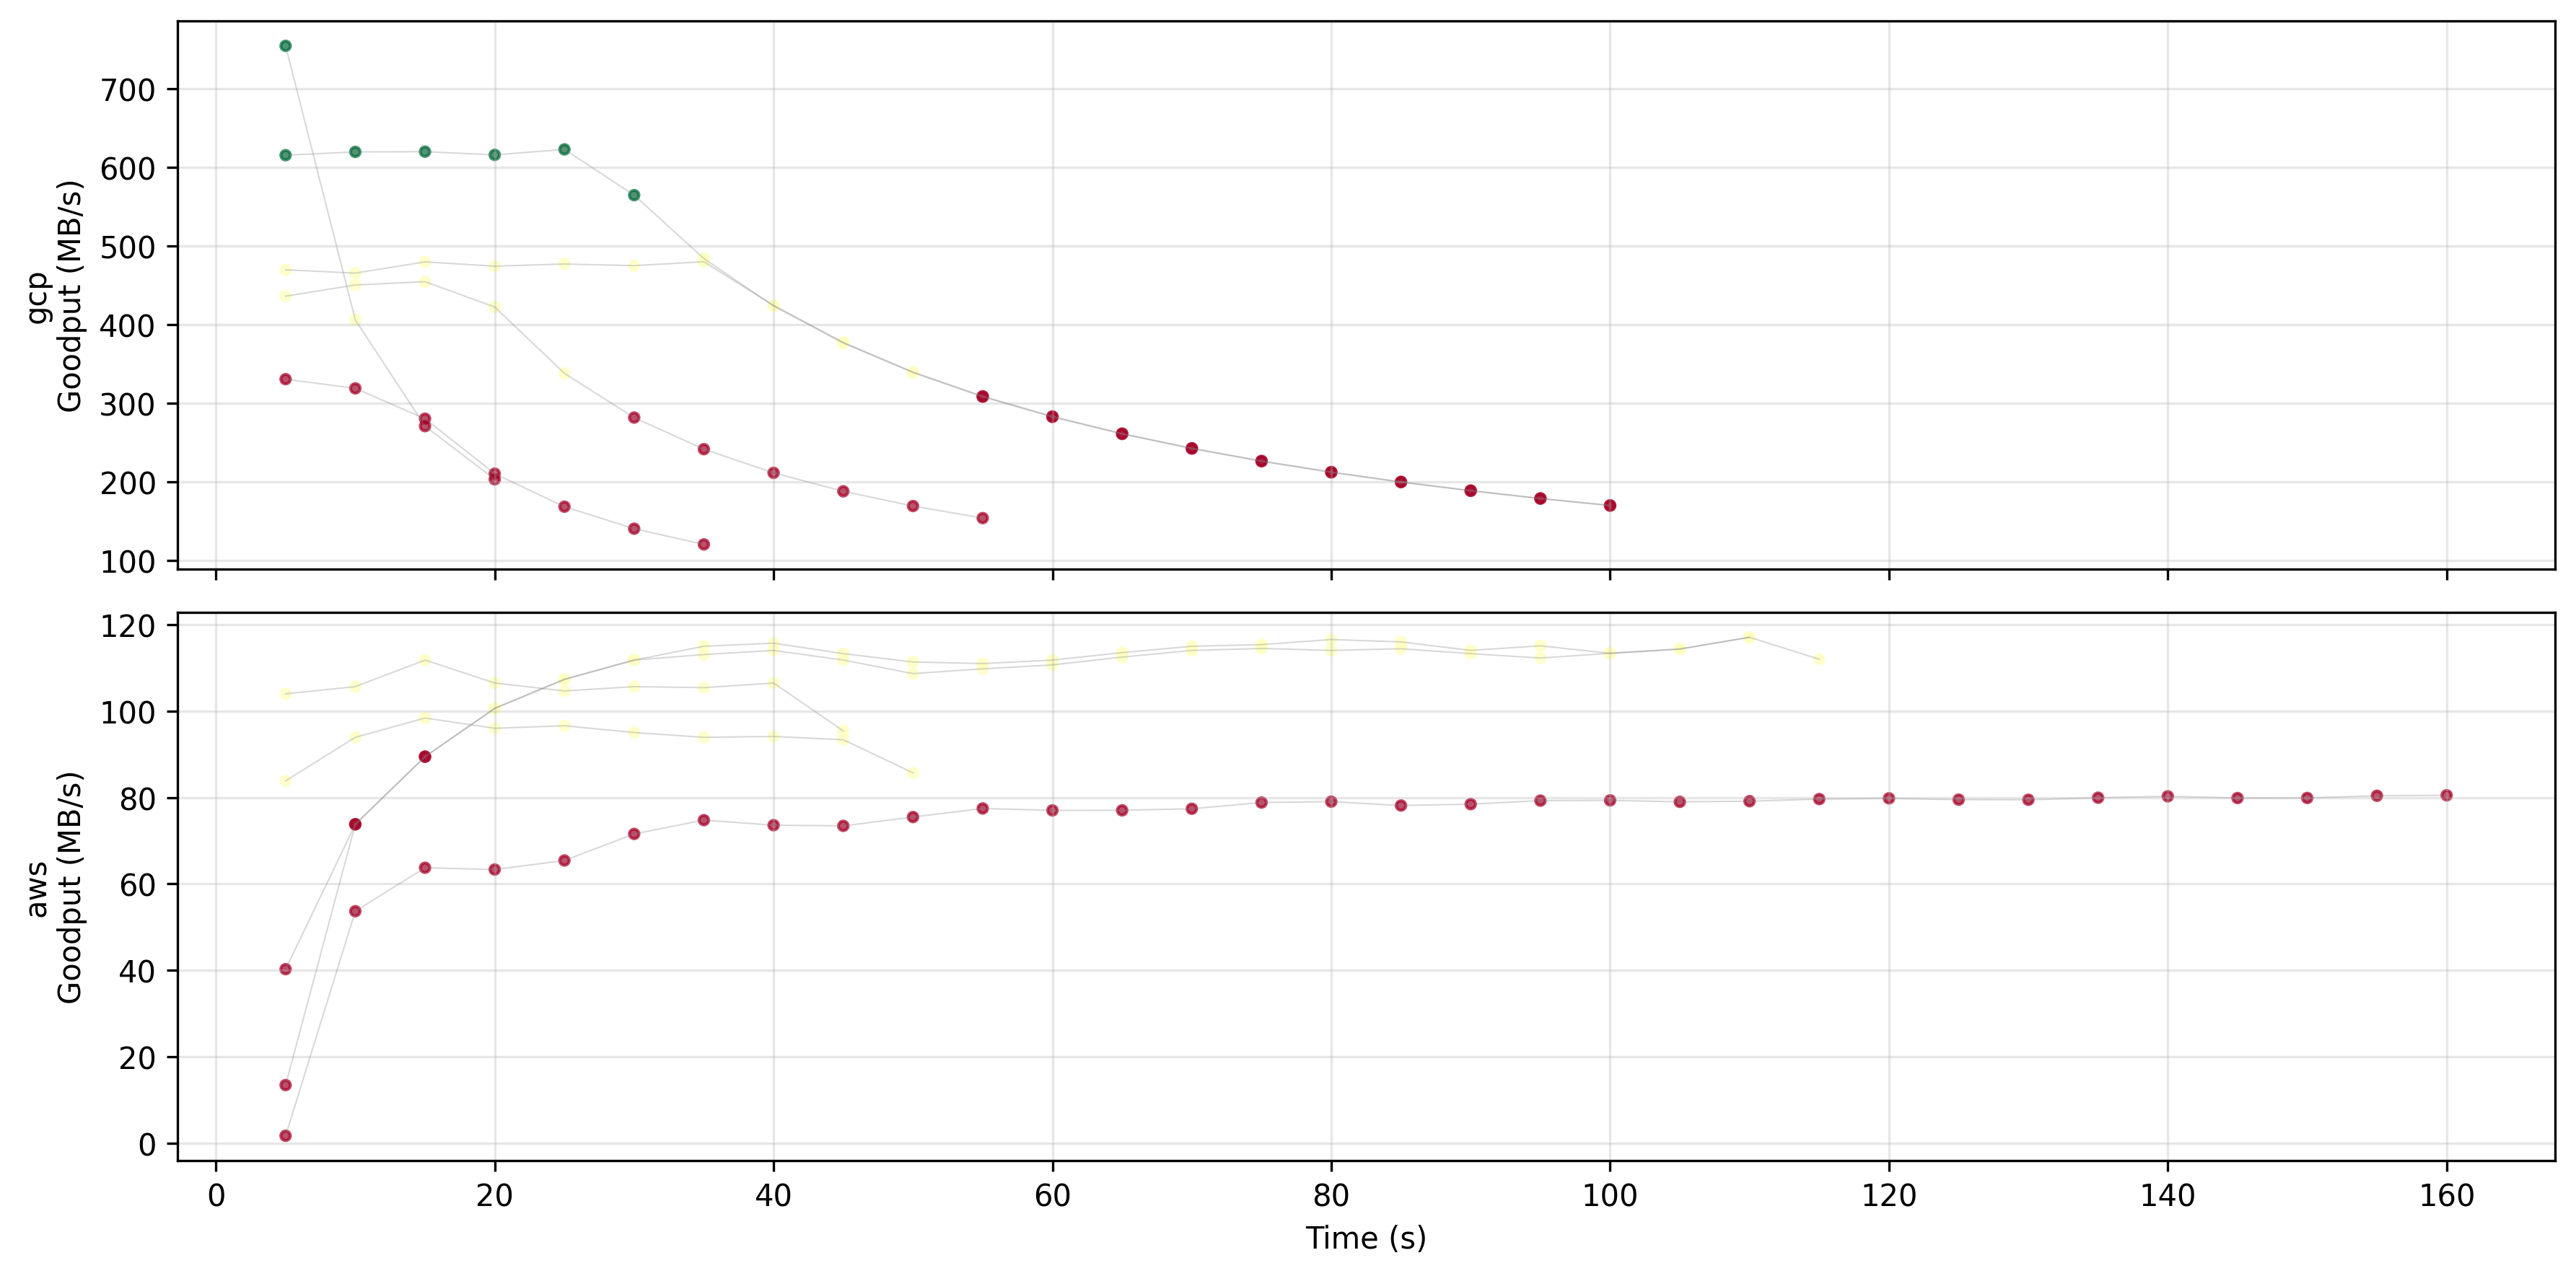
Upload speed regimes: fast, slow, degraded
A Hidden Markov Model automatically classifies each moment of an upload into one of three speed states.
Median and worst-segment frontiers
| Provider | W (s) | Best-median config | Median Smax | Worst-seg Smax | Role |
|---|---|---|---|---|---|
| AWS | 120 | P=10, k=16 | 12 GiB | 0 GiB | Best typical |
| AWS | 120 | P=16, k=64 | 10 GiB | 4 GiB | Only robust config |
| GCP | 30 | P=10, k=64 | 14 GiB | 8 GiB | Best typical & robust |
| GCP | 60 | P=10, k=64 | 16 GiB | 16 GiB | Saturates grid |
Two very different operating postures
AWS gives two answers
Best typical capacity = 12 GiB, but zero worst-segment guarantee. The only robust config (positive worst-segment) drops to 4 GiB.
The operator must choose: maximize typical capacity, or plan around adverse observed conditions and accept lower capacity.
GCP aligns typical and robust
Even at 30 s, its best config offers 8 GiB in the weakest segment. At 60 s, the frontier saturates the test grid at 16 GiB.
Best-median and worst-segment configs are the same.
State size is a threshold, not a dial
Fraction of segments certified safe as state size increases — best config per provider
The dominant tuning knob is regime-dependent
Why the tuning advice changes
AWS — Straggler exposure
Multipart completion cannot finish until every required part has completed. Higher concurrency increases exposure to slow outstanding parts.
p95 slowest-part time (95% of uploads had a slowest part faster than this):
P=10 → ~13 s P=64 → ~65 s
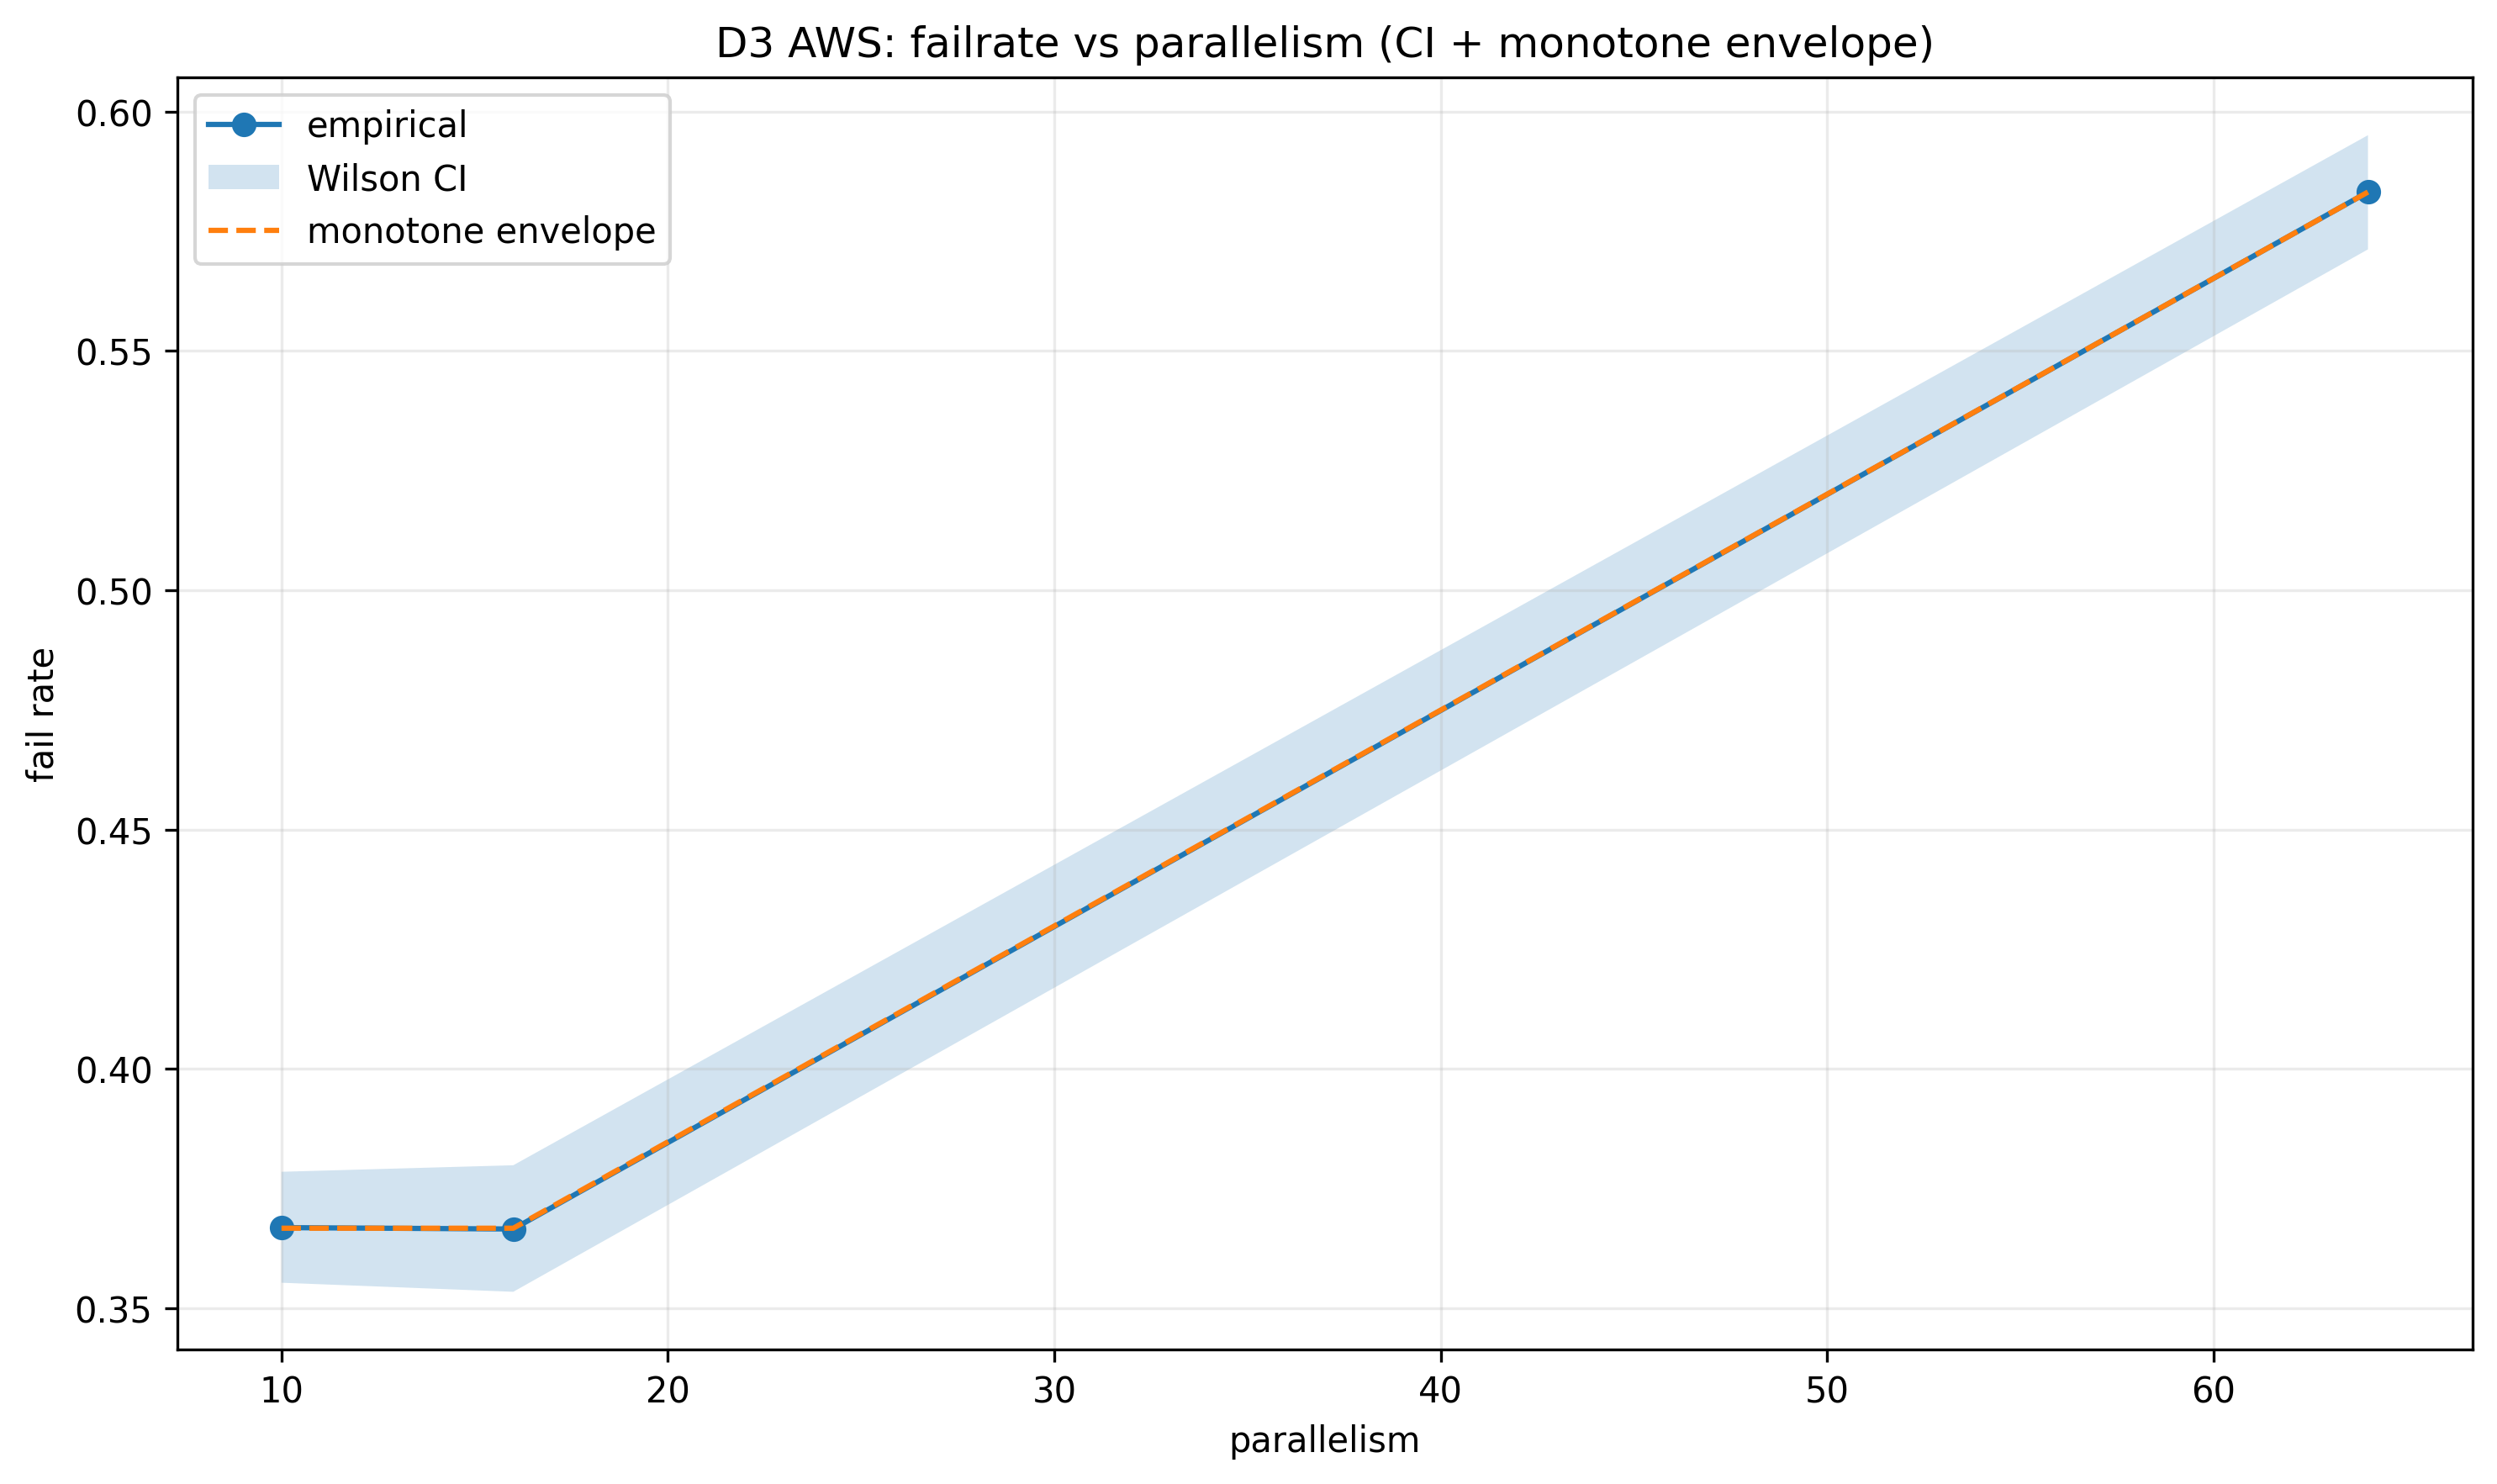
Fail rate climbs steadily: 37% → 58% as parallelism increases — more threads, more exposure to a slow part.
GCP — Chunk-throughput leverage
Larger chunks translate more strongly into useful end-to-end throughput on GCP in the tested regime.
p95 throughput at 16 GiB (95th percentile):
~696 MiB/s (best config)
The short-window frontier responds strongly to chunk efficiency rather than thread count.
Do the conclusions hold up?
- Swapping Wilson for Clopper–Pearson (a stricter way to compute the same confidence bound) changed 0 / 163 segment frontiers.
- Enforcing monotonicity — requiring that giving more time never shrinks the frontier — changed 0 / 18 configurations.
- Raising the threshold above 95% shifts individual frontiers, but qualitative conclusions hold.
Takeaways
Deadline-bounded state evacuation is a reliability problem. Throughput benchmarks miss the failure modes.
The SOA frontier gives operators a lookup table: given (provider, deadline, config), how large can the state be?
GCP certifies 14 GiB at 30 s; AWS certifies 12 GiB at 120 s with a cliff at the boundary.
Tuning guidance is regime-specific. Parallelism dominates AWS at 120 s; chunk size dominates GCP at 30 s.